

ELM comes with many preconfigured monitoring categories to help organize systems and when you deploy new agents they tend to get put into the defaults and stay there. But you can do so much more with monitoring categories to simplify configuration of agents on new systems, customizing dashboards to look at a select population of systems, and even Event Views and reporting on select groups of systems or breaking up large reports into segments for easier analysis.
Creating new monitoring Categories is quite simple. From the ELM Console (MMC) you’ll expand Monitoring and Management, then click on Monitoring Categories. A list of the current Monitoring Categories will be displayed in the right pane, most likely just the defaults. To create a new one, you’ll use the link at the bottom.
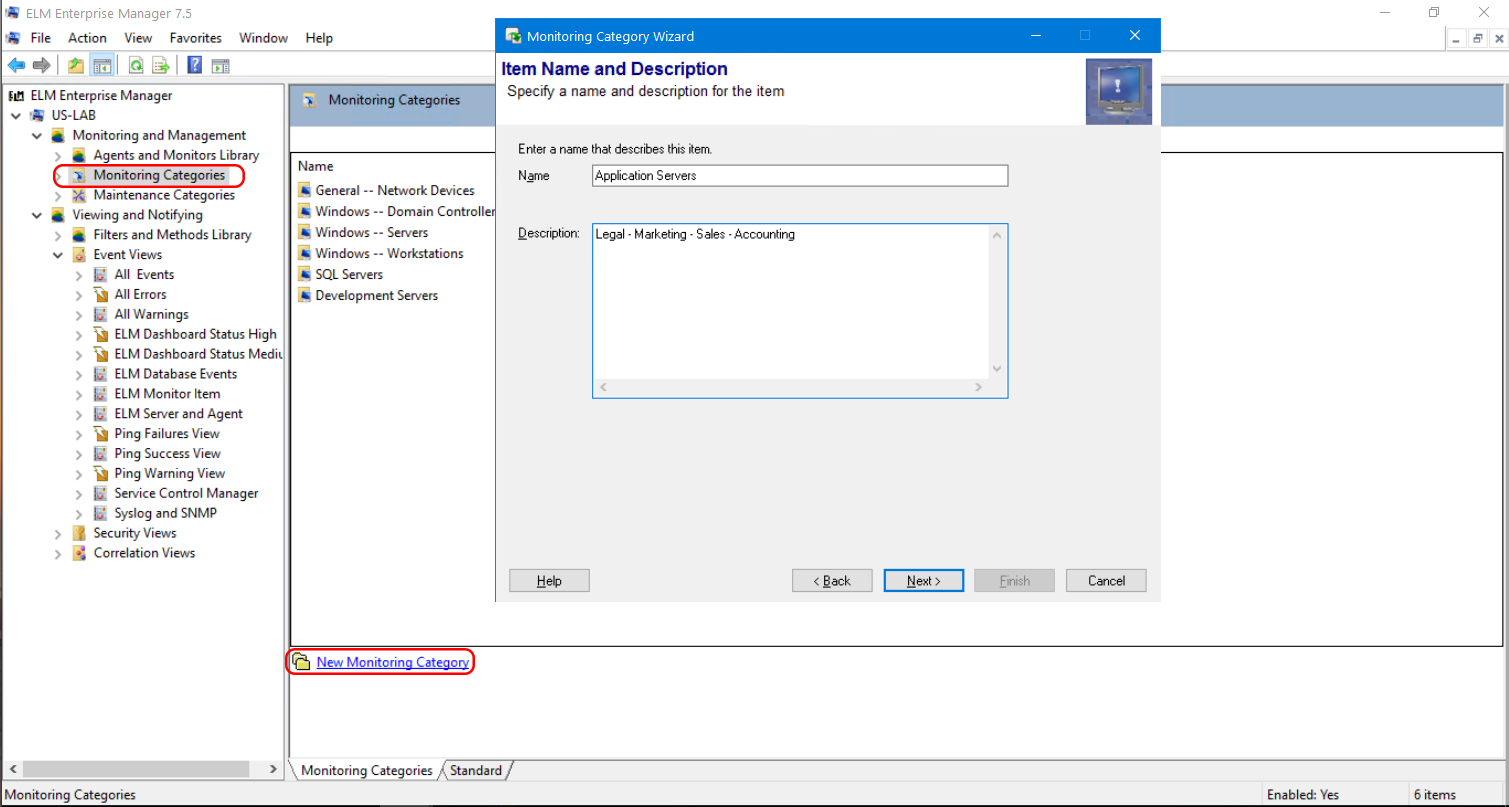
This will launch a wizard and walk you through the steps to create a new Monitoring Category. Along the way you’ll be prompted to choose a Name and Description, assign Agents, and assign Monitor Items. You can do this now or leave it empty and come back later to fill in these details.
Monitoring Categories as Deployment Templates
In our example above we’ve created three new Monitoring Categories – one for SQL Servers, one for Development Servers, and one for Application Servers. The rest you see listed are defaults within ELM.
For our Development Servers we are going to assign a set of specific monitoring items to this category to be used as a template.
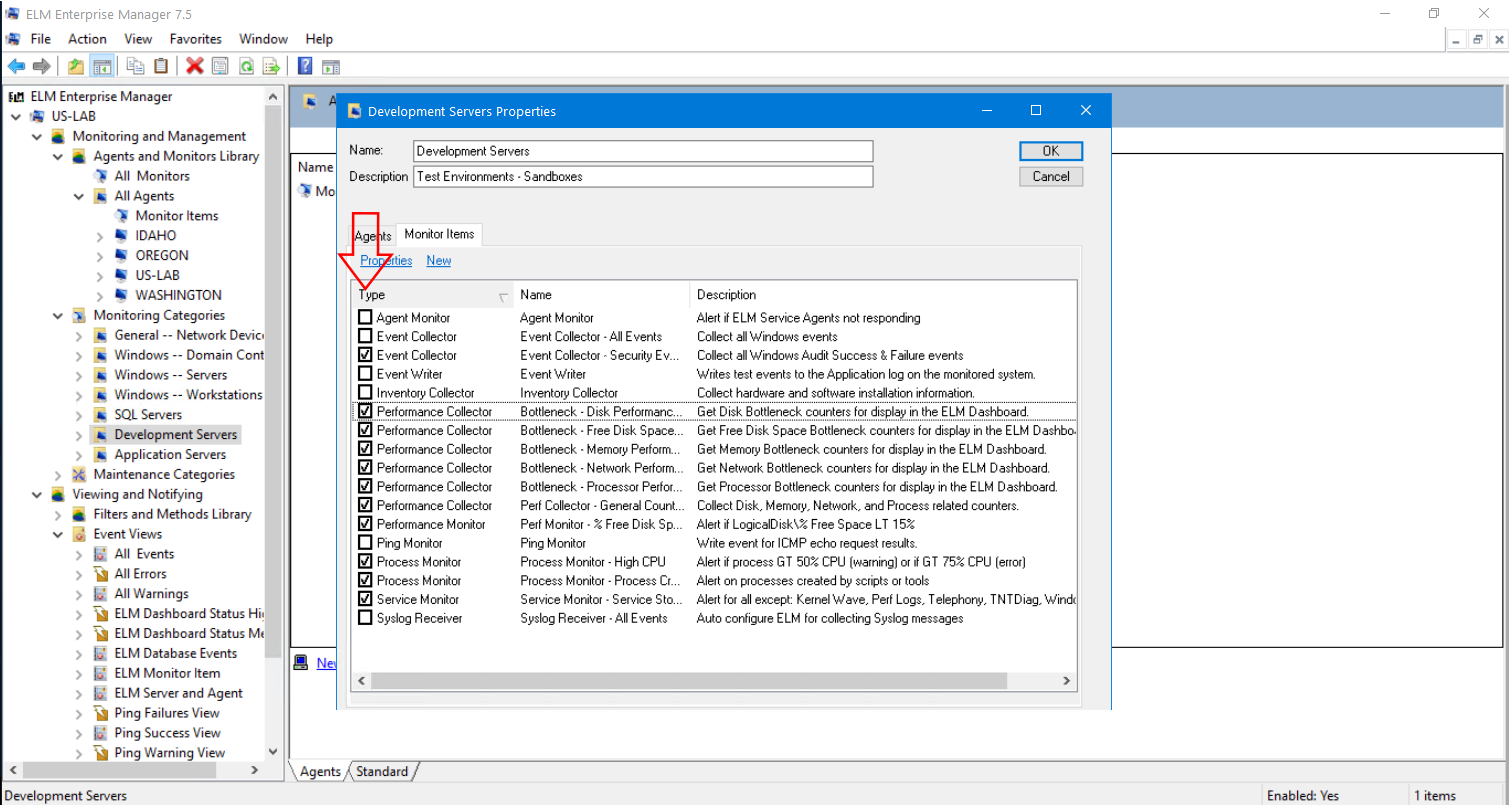
By doing so any new servers that are assigned to this category during agent deployment (or anytime after) will automatically pick up these monitor items which will collect the specified data.
There’s no other configuration needed – the template is done! You can come back at any time and modify the Monitor Items assigned to this Monitoring Category vs going to each Agent to make changes.
Views and Reporting
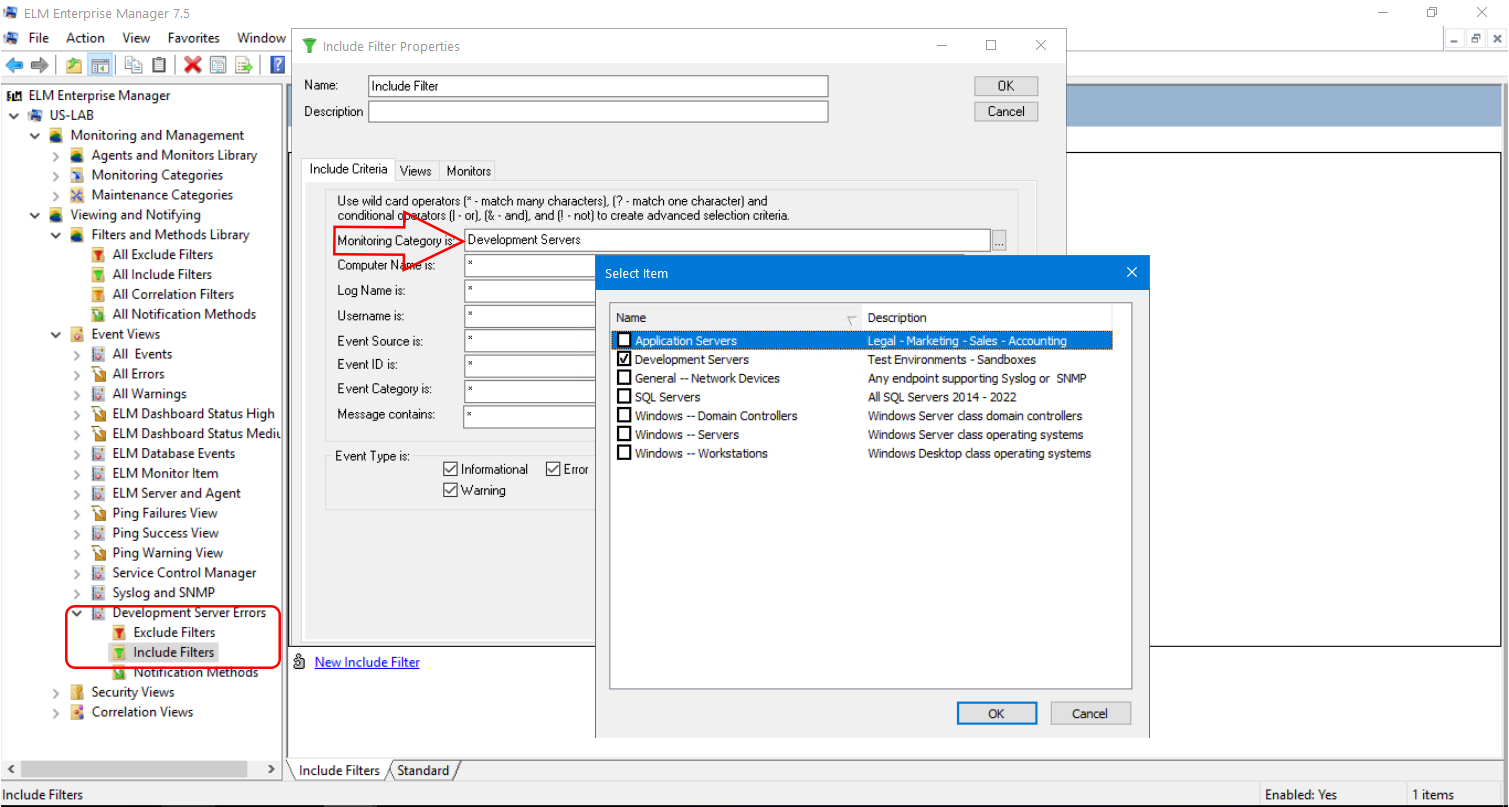
When creating a new Event View in ELM, whether it’s for notifications or reporting, you have the option to assign a Monitoring Category to the filters within the View. Think of it as a top-level filter which can be used on Include or Exclude filters. You can also fine tune existing filters by editing them and selecting a Monitoring Category or Categories to include.
Reporting
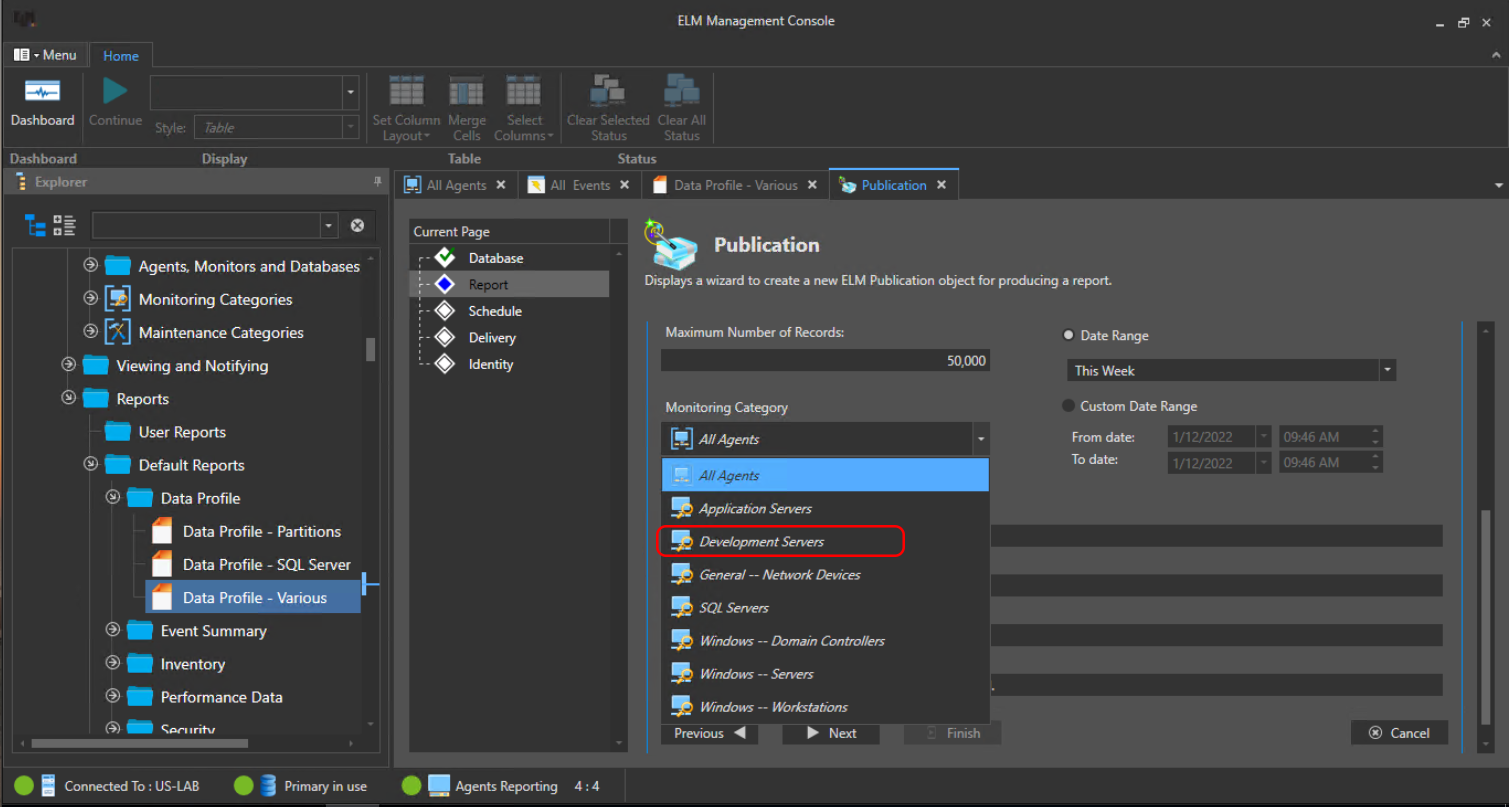
When we jump over to the ELM Management Console you now can the publish any existing report and specify the Monitoring Category you’ve created or a report from an Event View which is using Monitoring Categories as part of the filtering. This can be very helpful if you need to break apart a large report, say All Windows Servers, into more manageable sizes. These reports can also be shared with select teams who are responsible for specific categories of servers. Perhaps your SQL Admins don’t want to be bothered with data on Application Servers.
Dashboards for Groups of Servers
Finally let’s take a look at the possibilities with the ELM Dashboard. By default you can view performance metrics and bottlenecks for All Agents. But once again, perhaps your team has different responsibilities and those responsible for the Development Servers don’t really care what’s going on with the Application Servers, and vice versa. By double-clicking on a Monitoring Category from the ELM Management Console it will display a document that shows that particular Monitoring Category and therefore only the servers assigned to it.
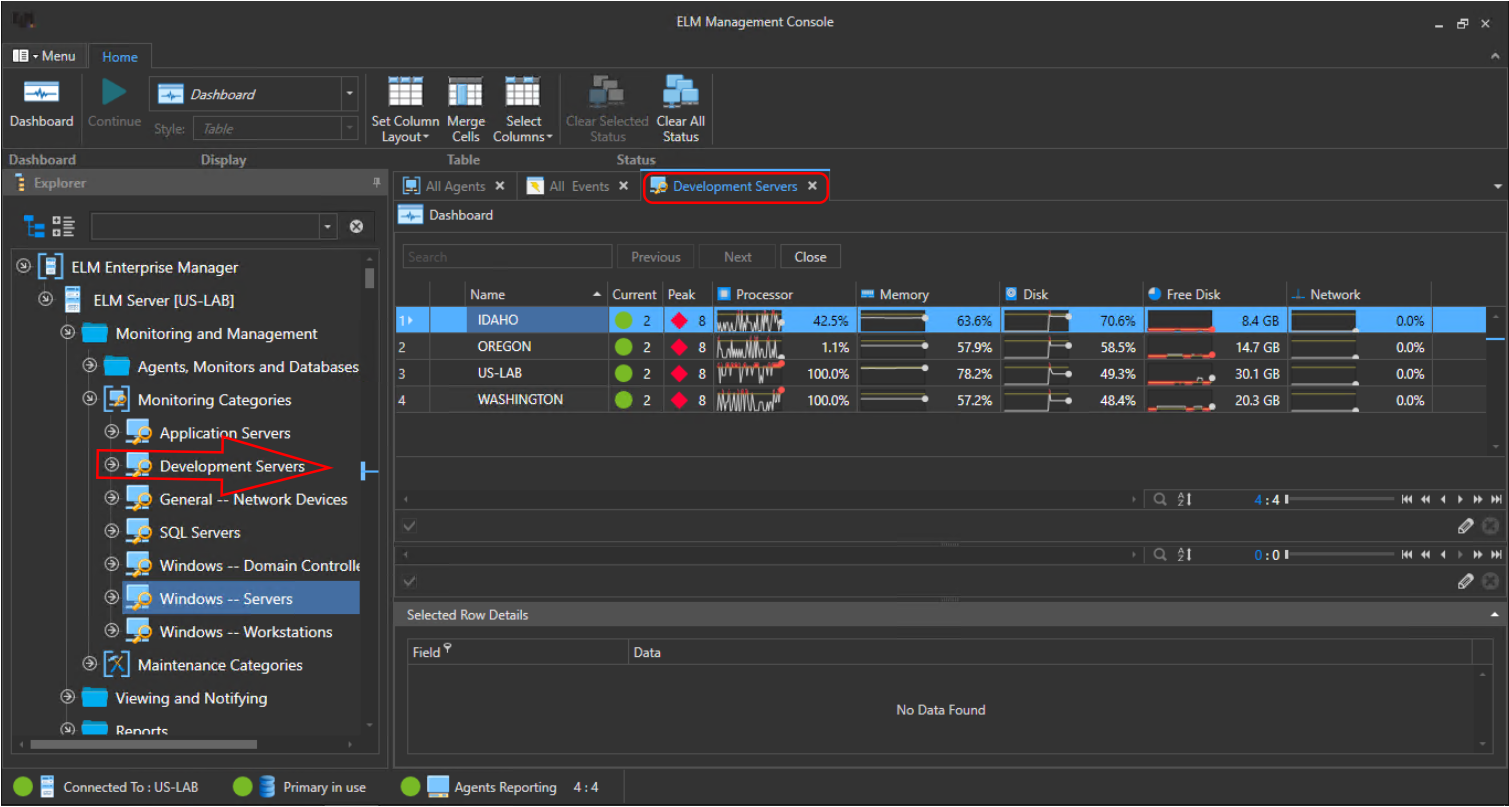
By breaking up your population of servers into Monitoring Categories you can essentially have multiple dashboards open in different tabs for quick access to the system statuses you and your team care the most about.

We hope you found this article on Monitoring Categories useful and wish you continued success with ELM.